Monthly Archives: June 2015

Visualizing Microbiome Data: Choropleth Style

A Pipette and an Open Mind

Recently I’ve needed to visualize spatial changes in my microbiome data that are easily interpretable by other people. The best solution I’ve come across is simply projecting the data onto a drawing of my organism. Like this:

Zostera marina high resolution Alpha diversity of samples from pieces of a seagrass plant projected onto a drawing of that plant.

I’ve used SitePainter to produce these in the past, and in some ways it’s great. I got the figure I wanted and I’ve received a lot of positive feedback about it. The only problem is it has a steep learning curve and is the most dysfunctional GUI I’ve ever come across (generating the figure above took several days of my time, the first time). So when it became necessary to produce over forty more images like it I decided to search for a better way.

My first instinct was that there should be an easy way…

View original post 694 more words

ASM Highlights

The Seagrass Team (Hannah, Jenna & I) hit up ASM this year which was in New Orleans. In case you missed ASM, Jonathan took the effort to compile all the tweets together (#ASM2015) and his efforts can be found: here.

However in case you don’t want to wade though thousands of tweets I’ve included some some brief highlights:

NCBI’s Targeted Loci Blast (MOLE-BLAST)

  • Using MOLE-BLAST you can blast specific 16S or ITS sequences against NCBI currated databases for those marker genes. This seems like it could be really useful if you want to identify bacterial or fungal taxonomy using a marker gene approach. Also, MOLE-BLAST appears to use a tree based approach to help you find the nearest neighbor for taxonomy assignment.

Carl Zimmer’s Talk on Microbiomes and the Hyperbolome

The Session that kept Redefining the Tree of Life (aka Unearthing the Dark Matter of Microbial Metabolism and Diversity)

  • Unfortunately, I missed this session, but apparently both Brett Baker (@archaeal) and Laura Hug (@LAHug_) shook things up
  • Brett Baker brought Thorarchaeota to the party, a monophyletic group that looks like it branches between Lokiarchaeota and Eukaryotes
  • Then Laura Hug showed up with Woesearchaeota and Pacearcheoata, not sure where they fit in, but cool

Contributions to “Extreme” Microbiology by Female Scientists Session

  • The whole session was awesome (and extreme), but Emmie de Wit gave a heartfelt (and tear producing) talk on being a first responder to the Ebola outbreak in Liberia
  • Also, I now really want to go to the Bonneville Salt Flats that Betsy Kleba talked about

Honorable mentions: John Zehr (Talk on open ocean Nitrogen fixing symbionts), David Baltrus (Talk on fungal endophytes with bacterial symbionts in their hyphae), Michael Wagner (Talk on syntrophy between nitrite and ammonia oxiders and alternative substrates for nitrification), Tom Marshburn (A real life astronaut!), Tom Sharpton (A Shotgun Metagenome Annotation Pipeline (ShotMAP))

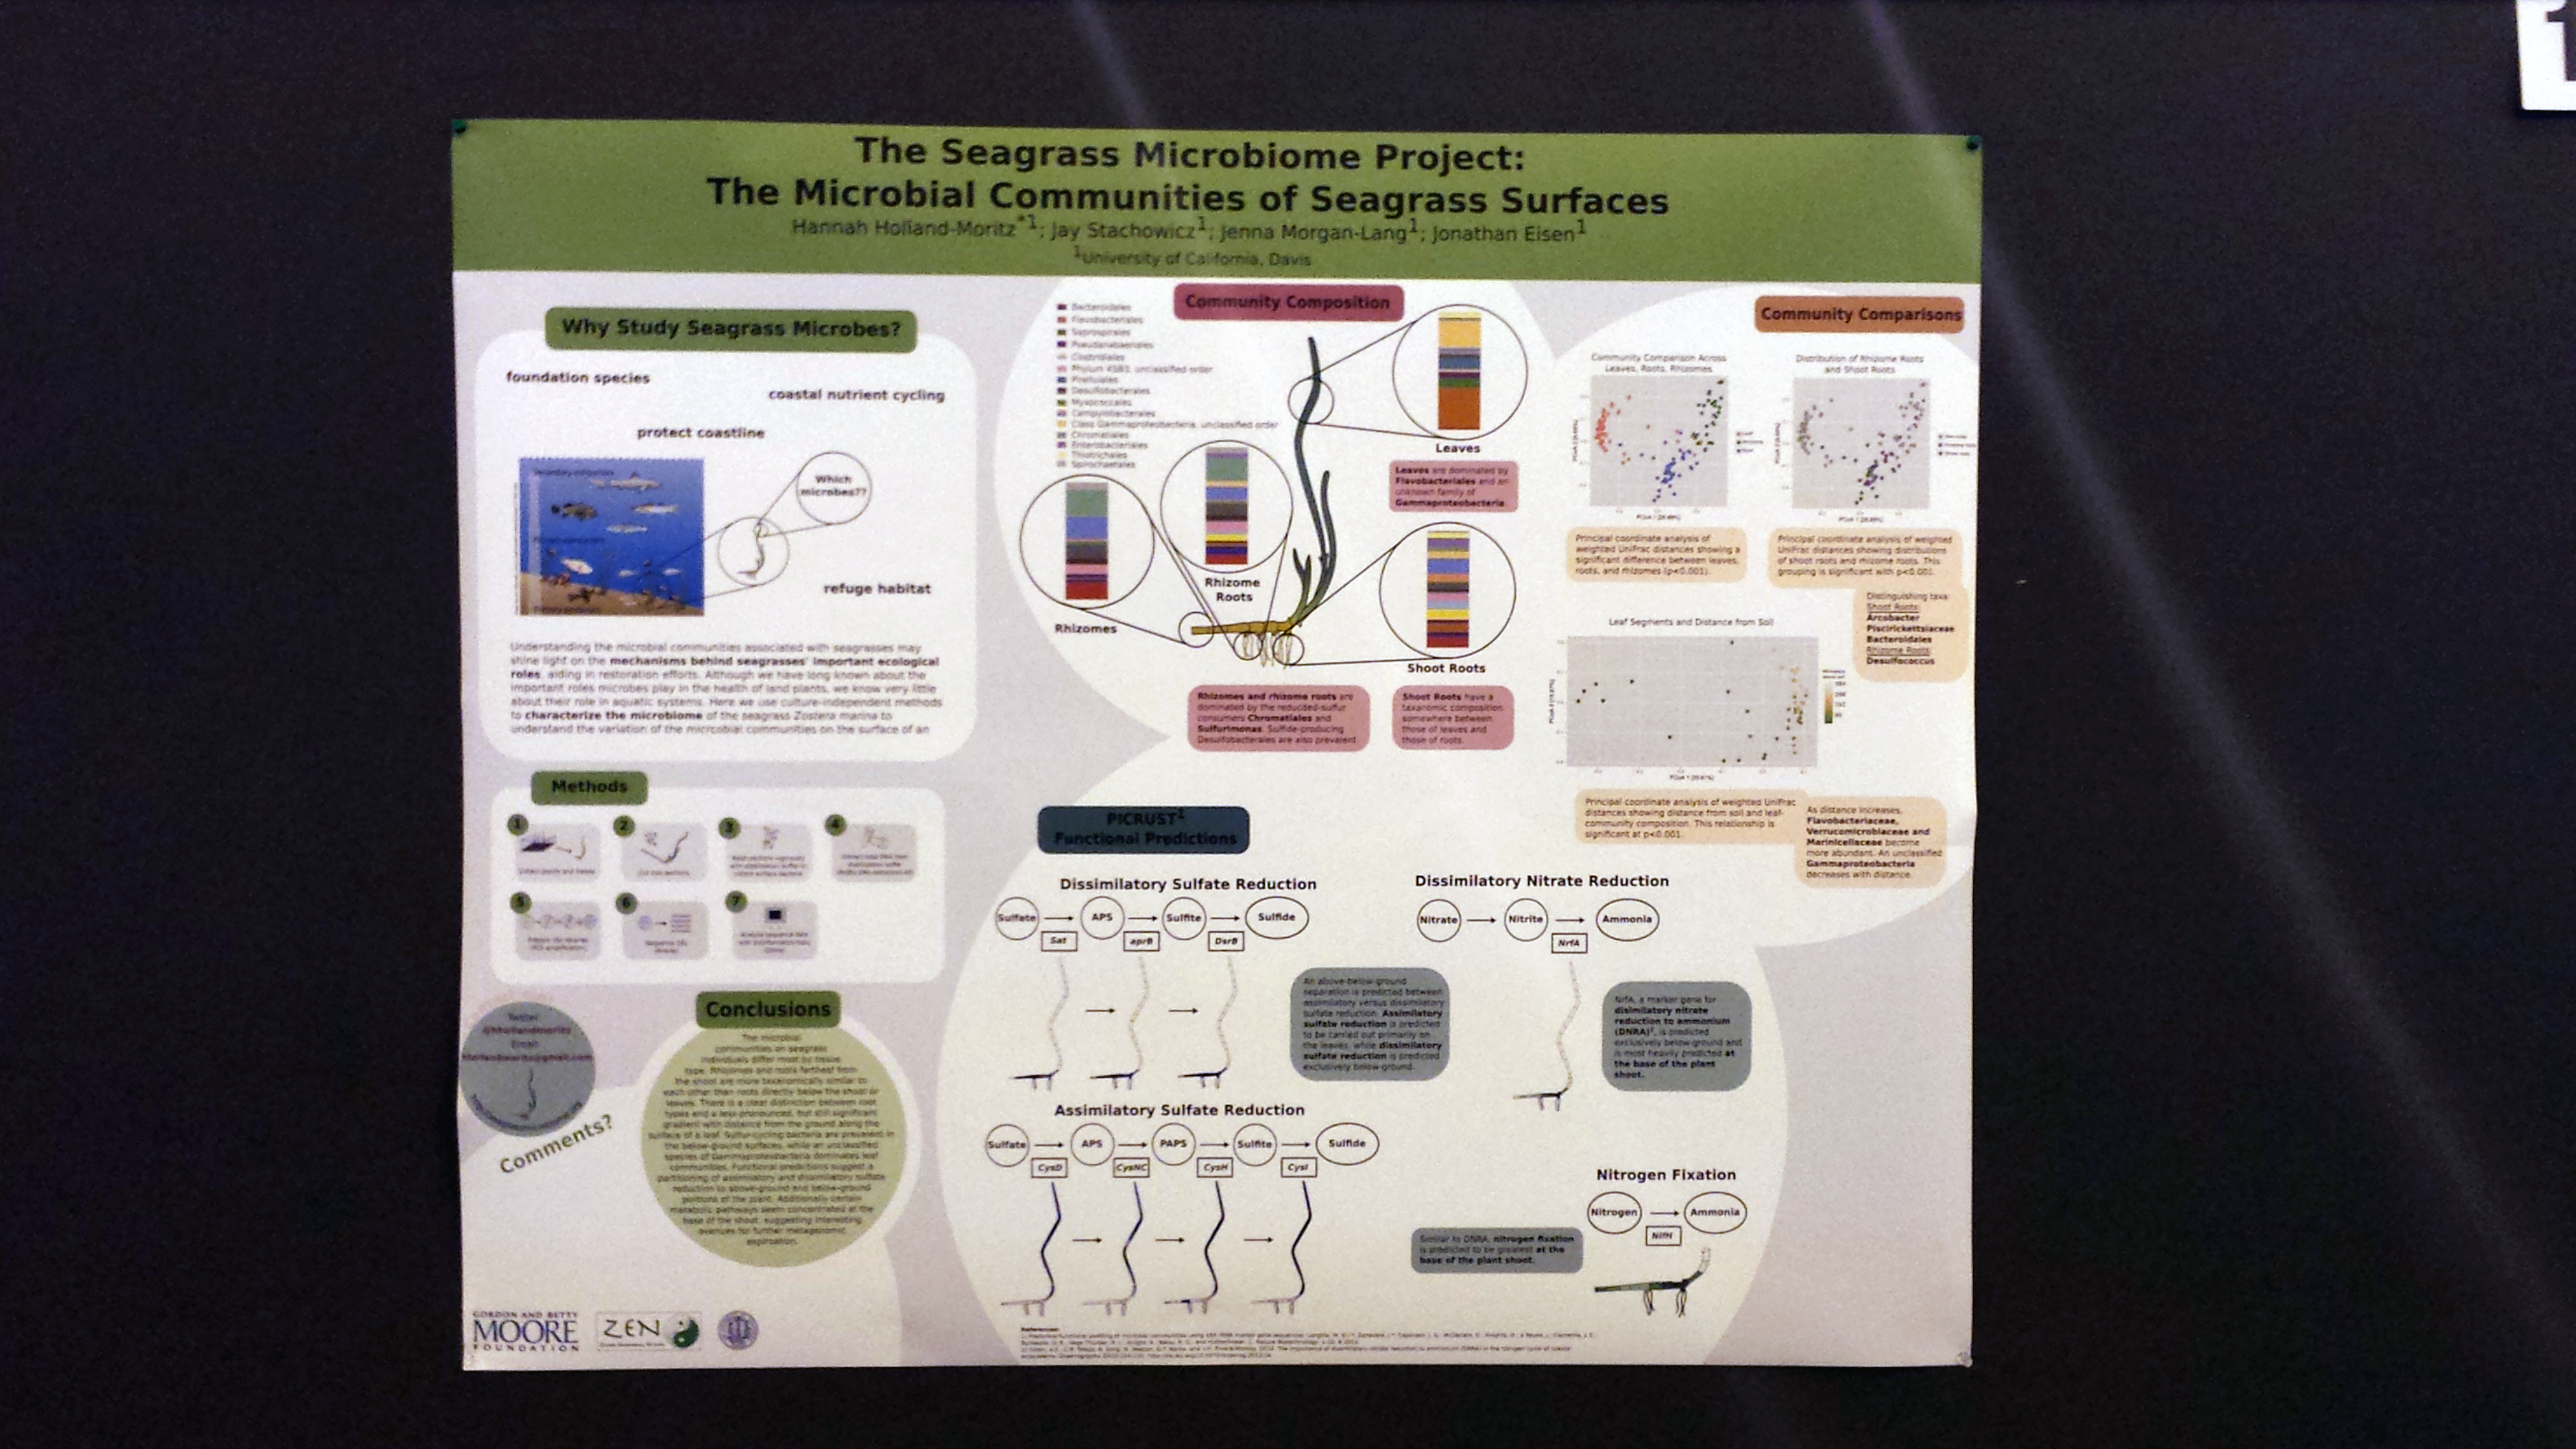
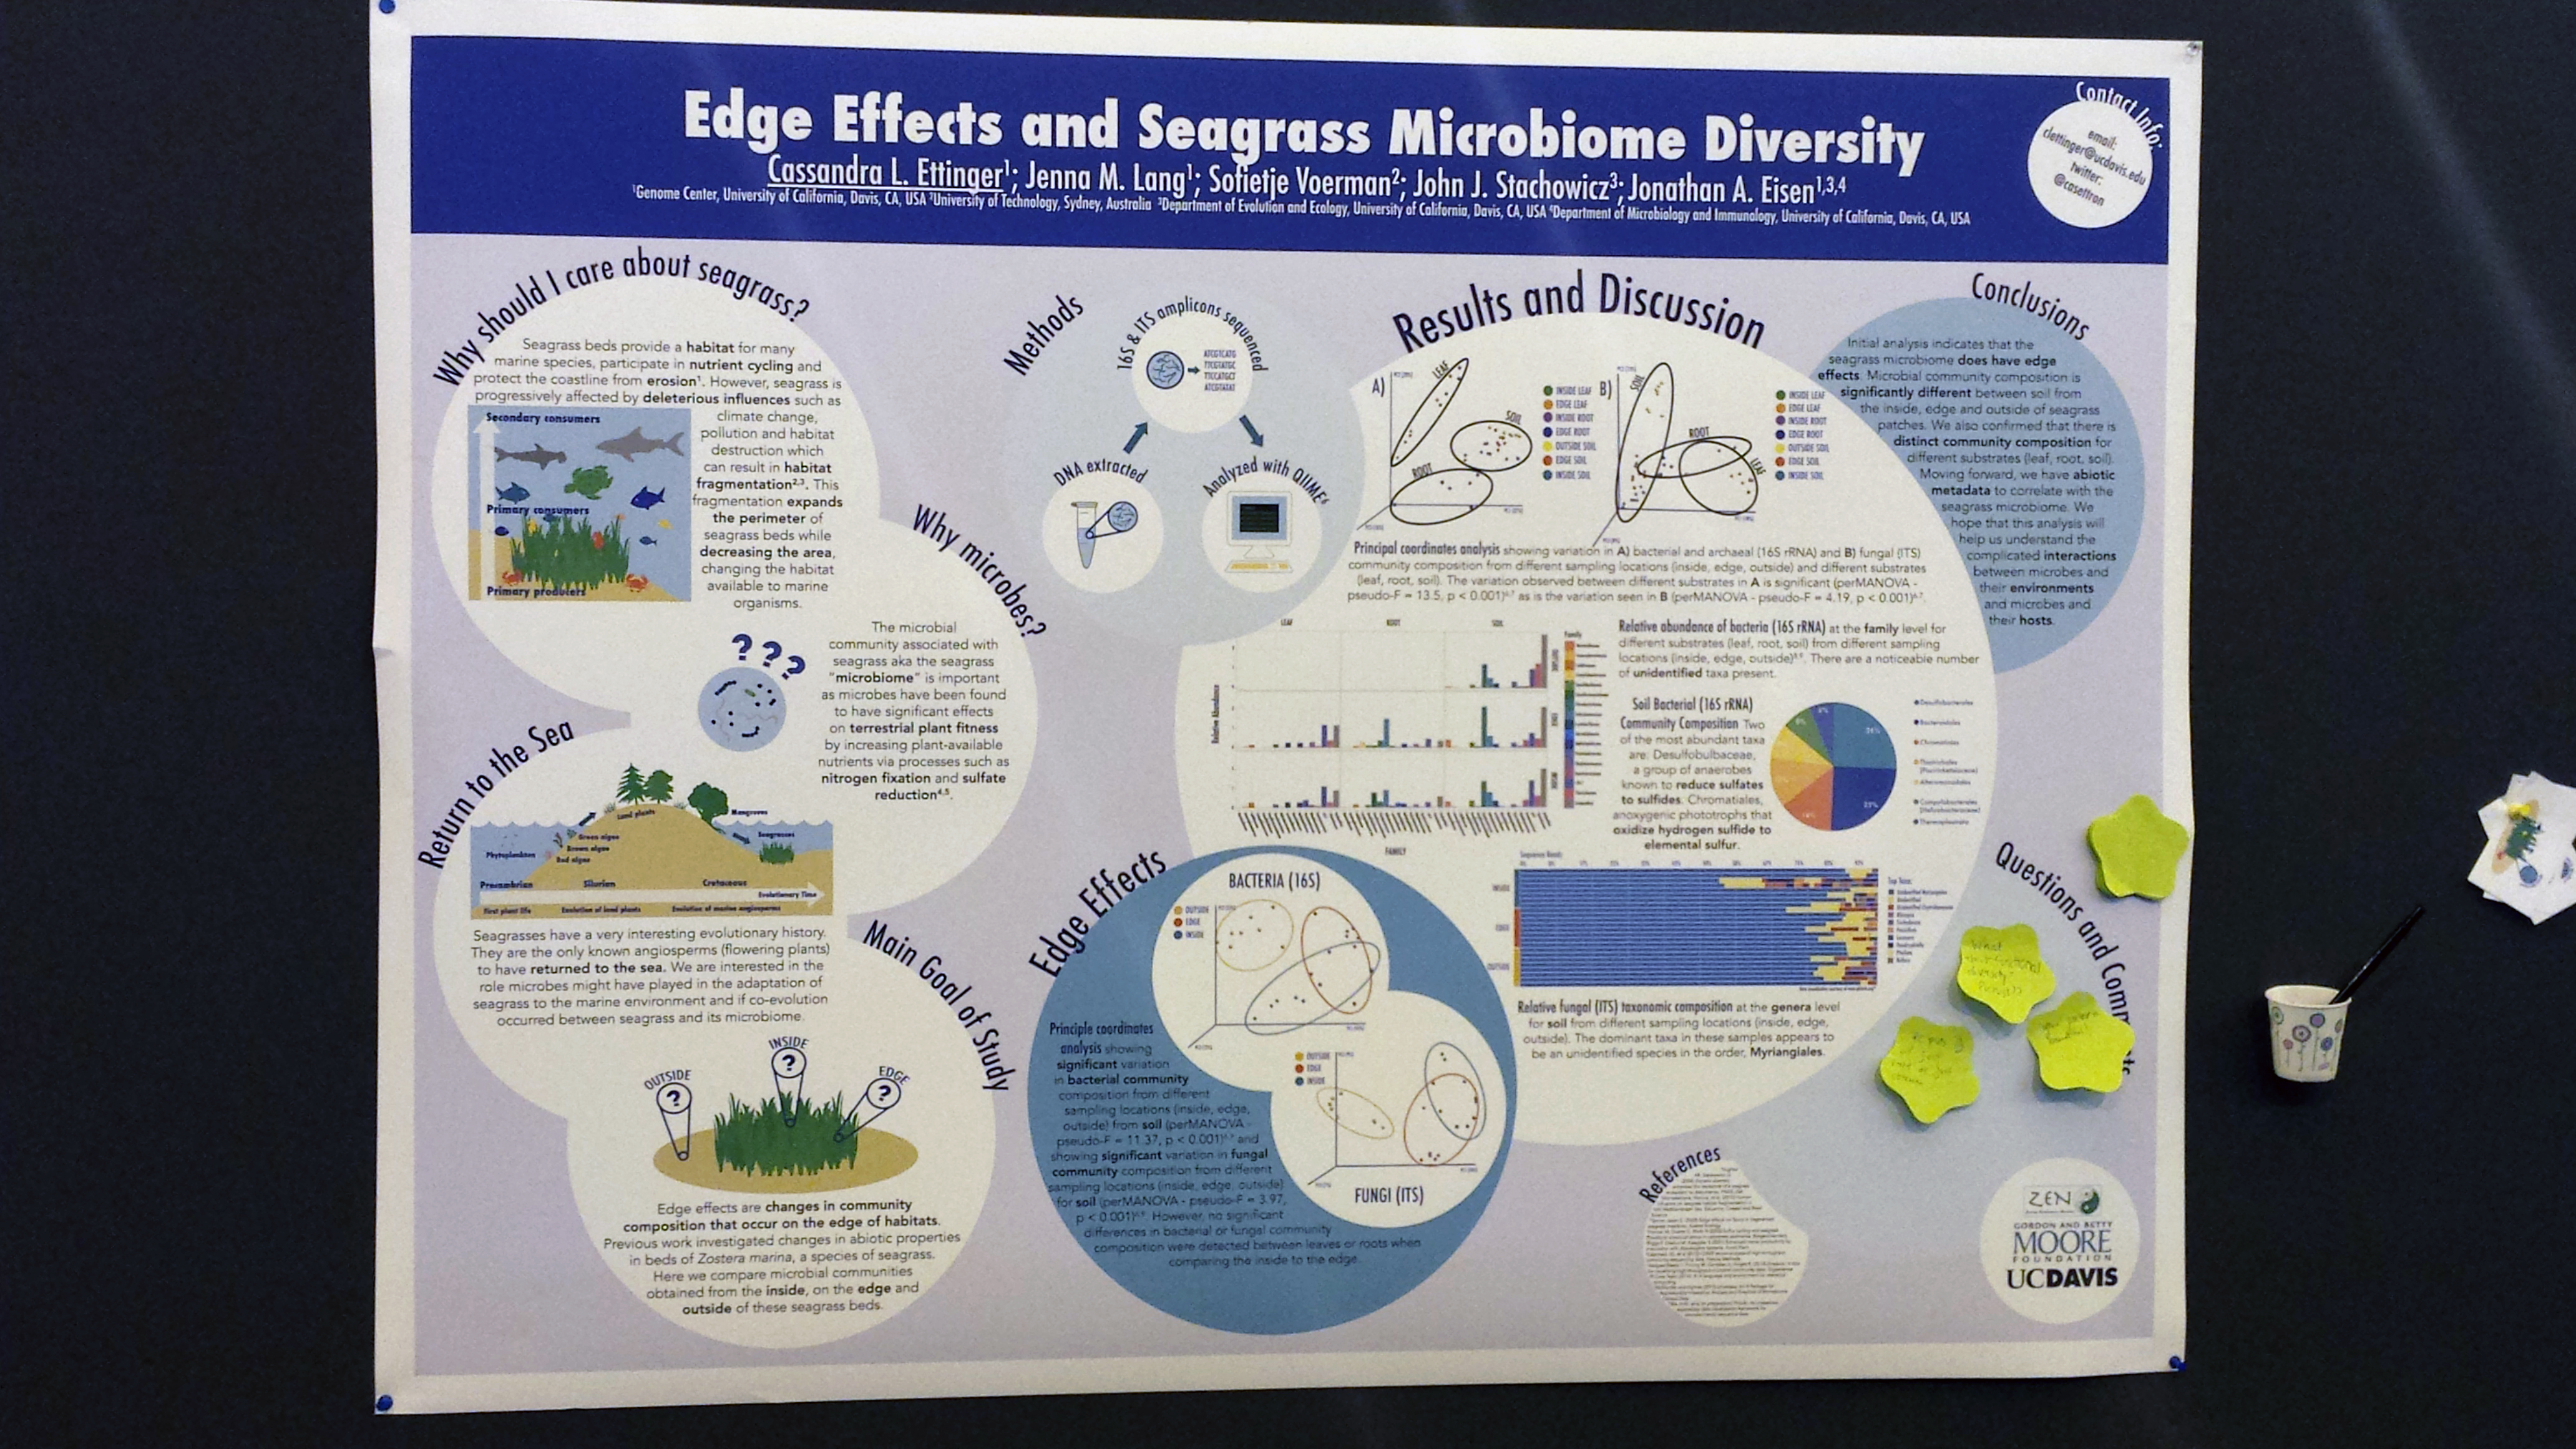
Hannah and I presented posters at the meeting, her poster (left, #1237) and my poster (right, #1236) can be seen below:

20150601_162116 20150601_162124

Of course, Team Seagrass wasn’t the only ones from the Eisen lab presenting at ASM. David Coil (@davidacoil), Srijak Bhatnagar (@srijakbhatnagar) and Megan Krusor (@MKrusor) also presented posters this year! See tweets with photos below.

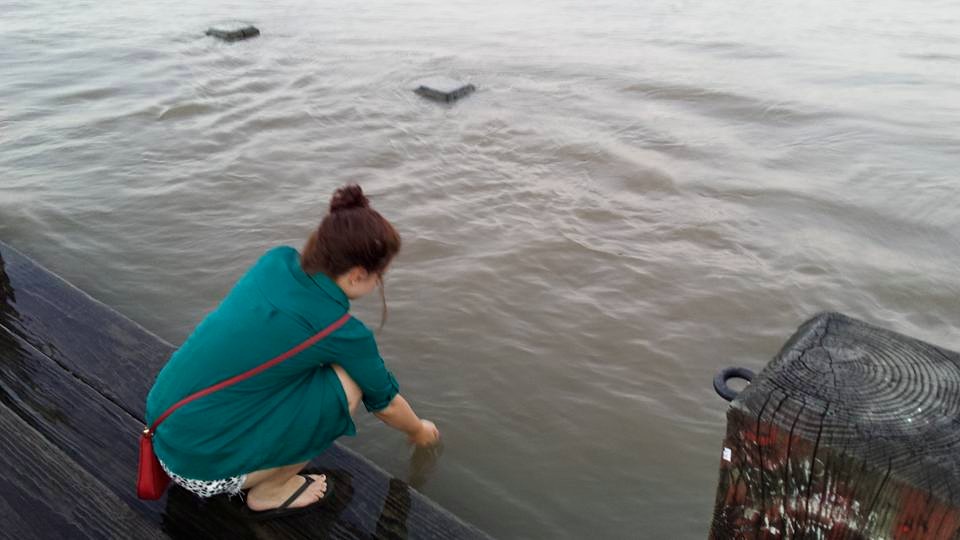
Some might say that the real highlight of ASM was New Orleans itself; it was my first time there and I really enjoyed being immersed in the culture (the music!), city and food (especially the food). Below is a picture of me touching the Mississippi River (my first time!). Unfortunately, the water was too murky to search for any seagrass or seagrass relatives.
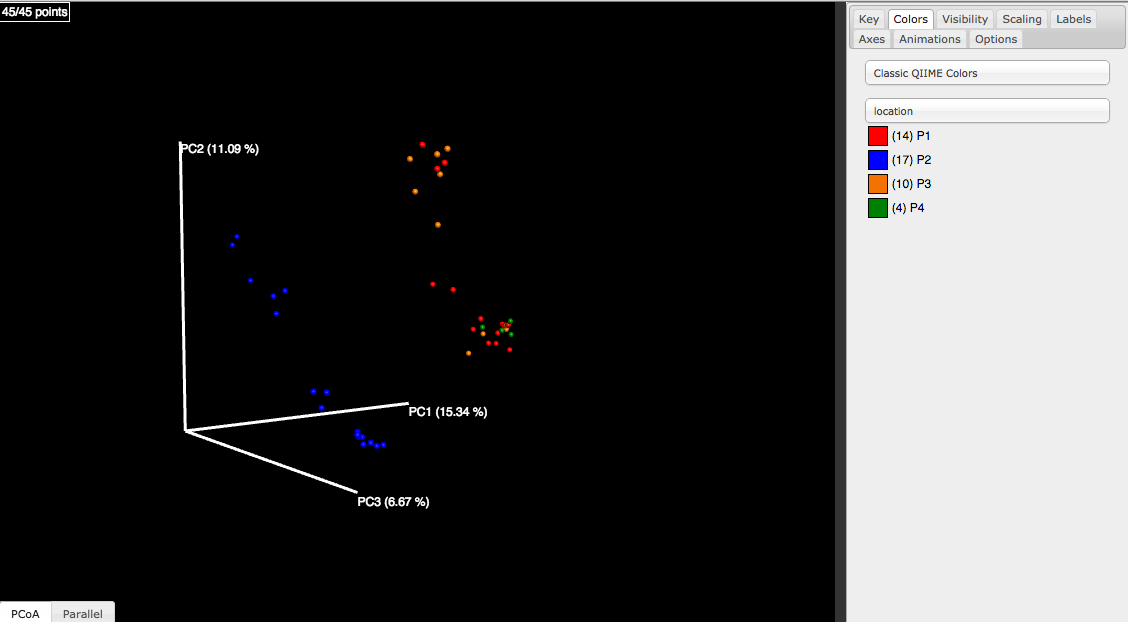
11391124_10205818157466724_2465408434093120848_n

Potomac Samples: not what we expected, but still some interesting connections

Last summer I went on a sampling expedition to the Chesapeake Bay for some SAV (submerged aquatic vegetation) collection. I came back with leaf and root samples from the Potomac River from a few different SAV species. Ideally, we thought the microbial community would correlate with the salinity gradient across the sites or the host species.

Neither of those patterns are discernible in this data set as far as the beta diversity plots are concerned, but I found some other interesting things while sifting through these plots. For instance, the samples cluster based on the site location (P1-P4). The communities at P1 and P3 look really similar and P4 is within the tail end of their cluster, while P2 is totally different. location

For reference, here’s a map of our sites:

Screen Shot 2015-06-05 at 11.21.11 AM
Whitehead, Andrew et al. “Genomic Mechanisms of Evolved Physiological Plasticity in Killifish Distributed along an Environmental Salinity Gradient.” Proceedings of the National Academy of Sciences of the United States of America 108.15 (2011): 6193–6198. PMC. Web. 5 June 2015.

Although all the sites were visited, I only found SAV species at P1-4. There are some useful patterns in the water and soil chemistry data (courtesy of Greg Mayer from Texas Tech University) that show the same correlation pattern as the site locations (as expected since each location has its own distinct chemistry data). Some of the chemistry data shows different patterns from site location, so I’ll have to sift through those next and see what looks relevant. I also ran a core microbiome script for each site, but haven’t looked at the output yet.

In addition, the leaf and root samples are pretty distinct:

sampletype

The alpha diversity graphs are a whole ‘nother beast that I’m going to explore some other time. That’s all for now, but I feel that there are some interesting lines of investigation to pursue and more scripts to run.